
What a Nottingham Racecard Tells You Before the First Bend
The Nottingham greyhound racecard is the single most information-dense document you will encounter before a race begins. Every field, every abbreviation, every number printed on that card exists for a reason — and the punters who learn to read it properly tend to outlast those who rely on gut instinct alone. Whether you pull up the card on a bookmaker’s app ten minutes before the off or study a printed programme at Colwick Park with a coffee in hand, the data staring back at you is identical. The question is what you do with it.
Nottingham runs across eight different distances, from the 305-metre dash to the 925-metre marathon, each producing its own type of race and its own demands on a dog’s physiology. The current track record holder on the flagship 500-metre trip is Proper Heiress, who clocked 28.95 seconds during the 2025 Premier Greyhound Racing Eclipse — the first dog in the venue’s 45-year history to break the 29-second barrier over this distance. Understanding why a particular time matters — and how to compare times across distances and going conditions — starts with the racecard.
This guide breaks down the Nottingham greyhound racecard field by field. It is not a general overview of greyhound form or a primer on betting markets. Those are separate conversations. The focus here is narrower and, arguably, more useful: learning to extract every last piece of intelligence from the card itself before the hare even begins its run. If you have never looked at a racecard before, you will leave this page knowing what every line means. If you already read cards regularly, you might find a few details you have been overlooking.
The racecard is your pre-race briefing. Everything else — the commentary, the tips columns, the social media predictions — is just opinion layered on top of it. The card is fact.
Anatomy of a Nottingham Racecard: Field by Field
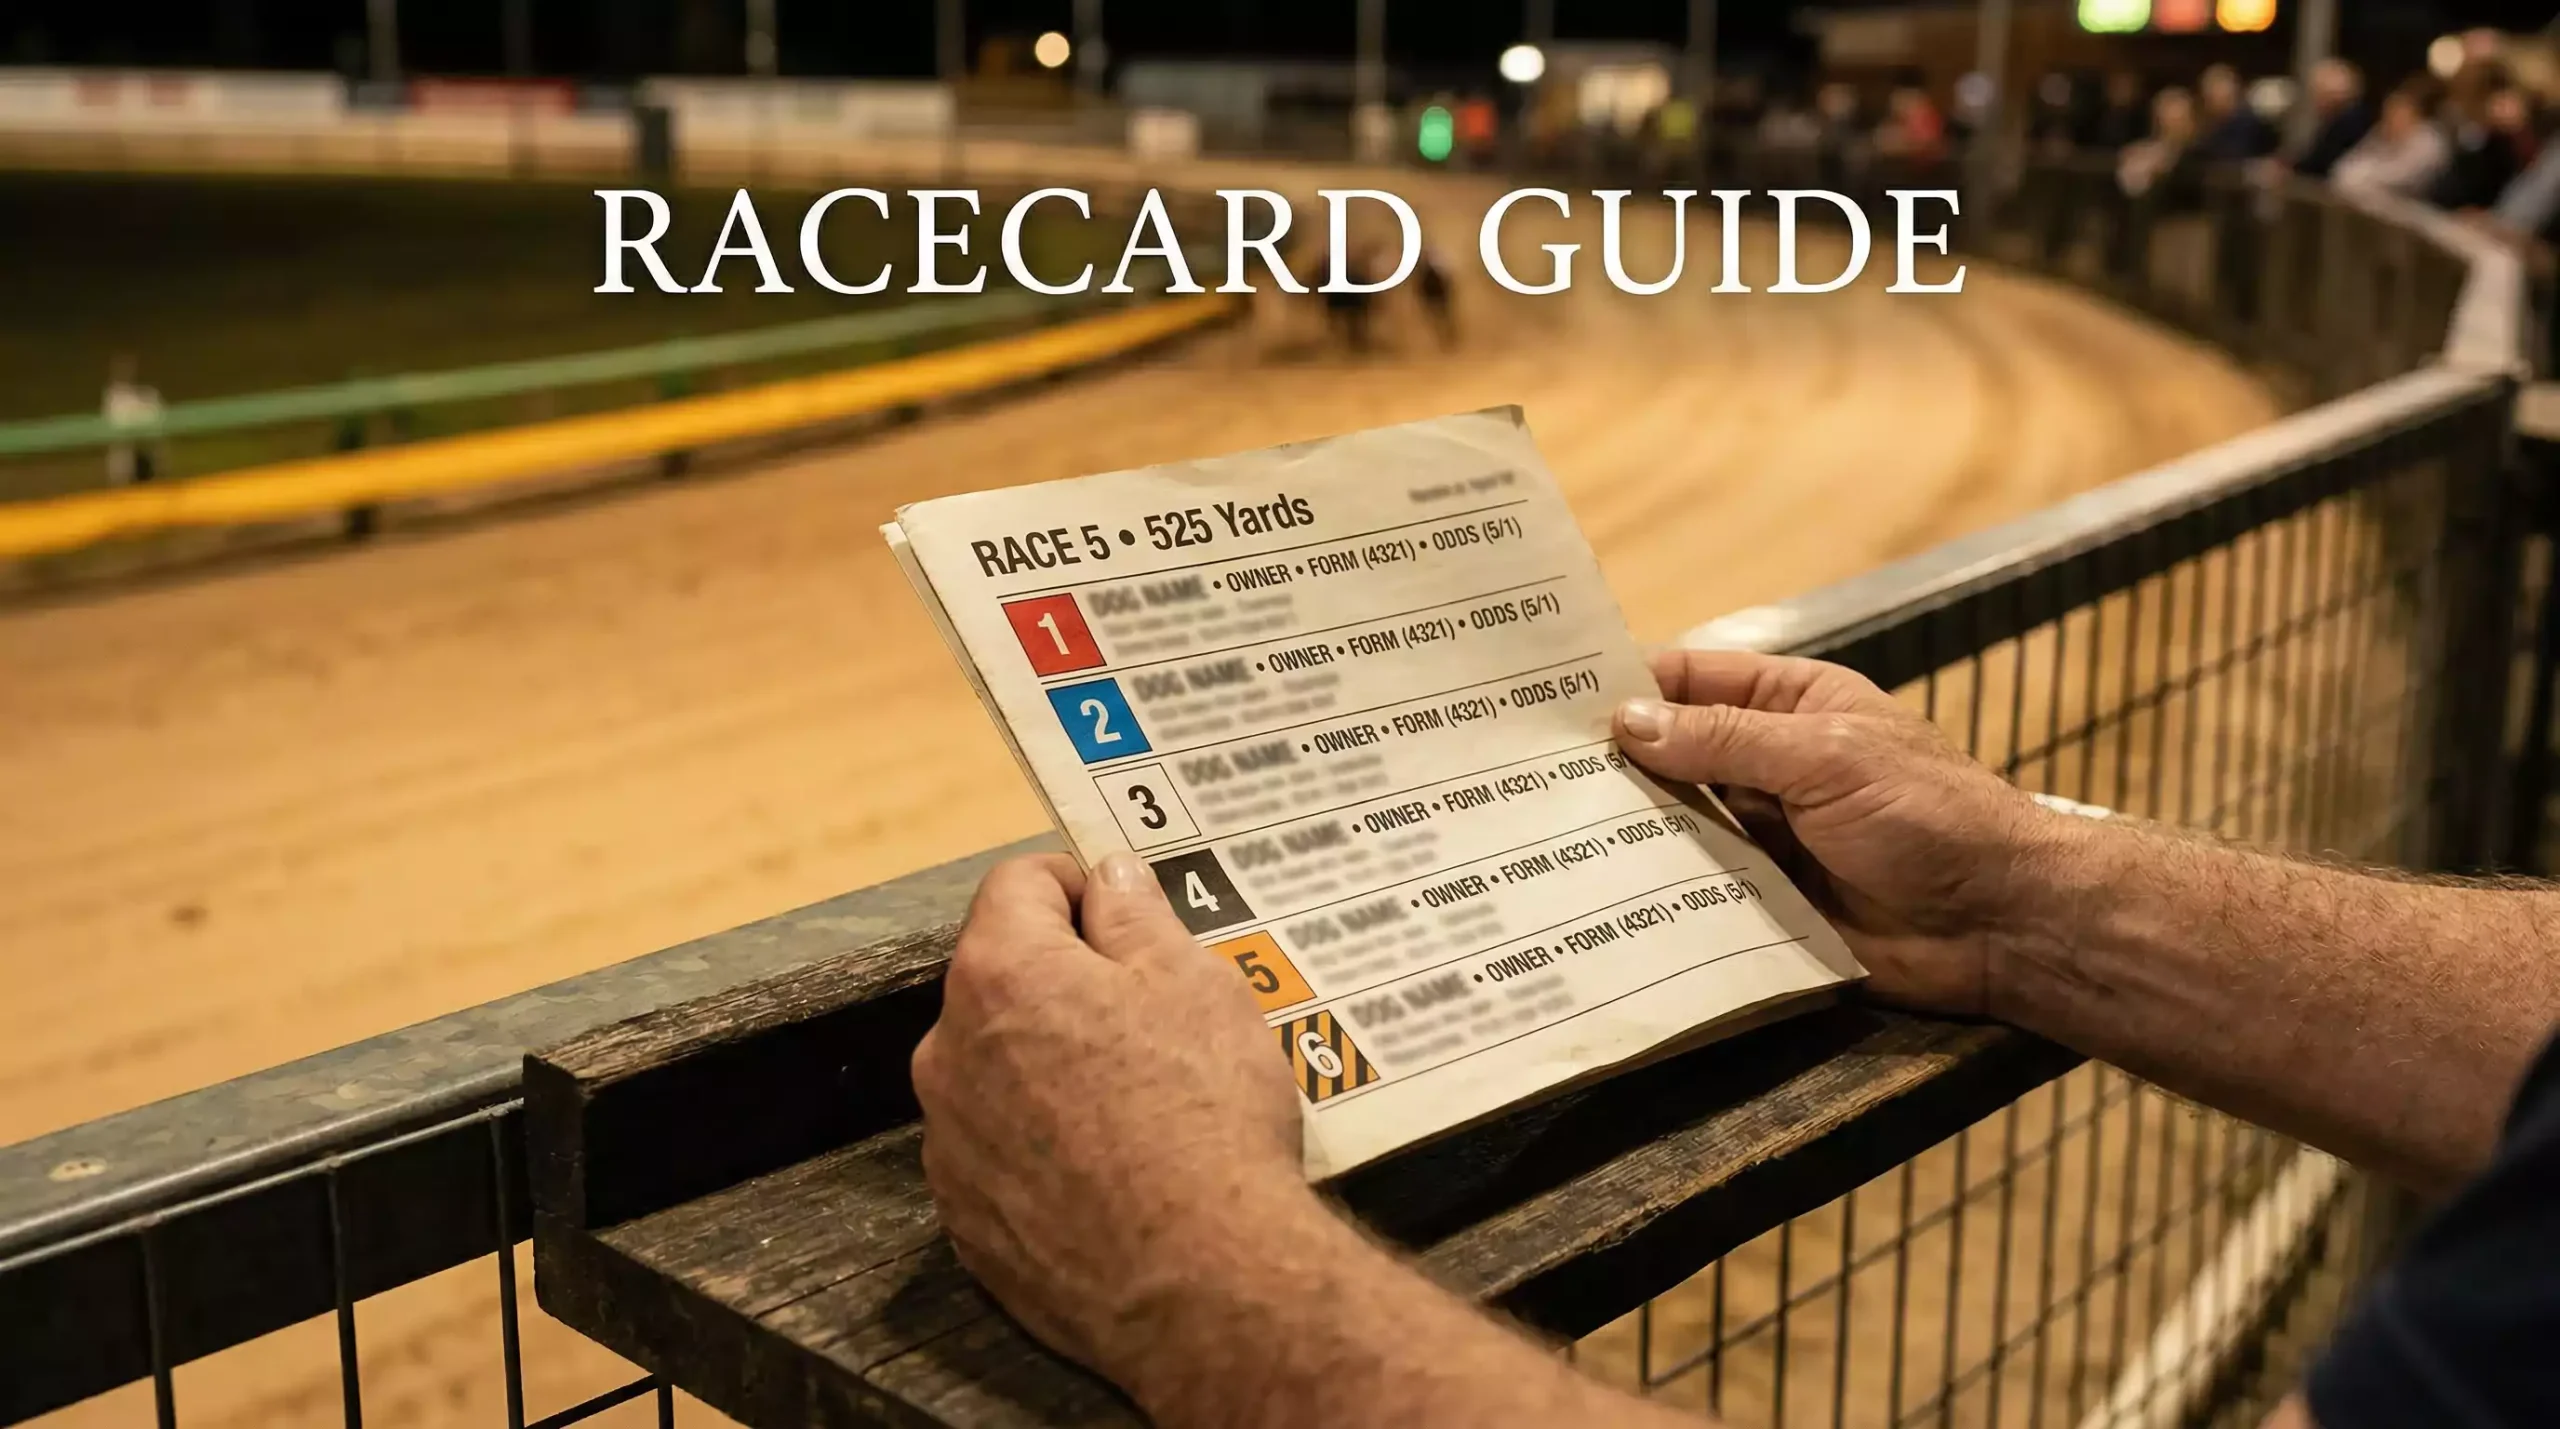
A Nottingham racecard presents six runners per race — the standard field size for UK greyhound racing — arranged vertically or horizontally depending on the format. Each dog’s entry is a compressed biography: identity, recent history, physical profile and breeding, all squeezed into a few lines of text and numbers. Here is what each field means, in the order you will typically encounter it.
Trap Number and Colour
The trap number appears first, usually accompanied by a coloured marker. UK greyhound racing uses a fixed colour system: Trap 1 is red, Trap 2 is blue, Trap 3 is white, Trap 4 is black, Trap 5 is orange and Trap 6 is black-and-white stripes. These colours correspond to the jackets the dogs wear, so you can identify each runner during the race without needing binoculars. The trap number is not random — it is assigned by the racing office based on the dog’s running style, recent form and the overall composition of the field. This assignment carries real tactical weight, a point that will matter considerably when you reach the section on turning card data into selections.
Dog Name
Below or beside the trap number sits the dog’s registered name. Greyhound names in the UK follow Greyhound Board of Great Britain naming conventions, where the name must not exceed 16 characters (including spaces and punctuation, per GBGB Rule 29) and cannot duplicate an existing active registration. Some trainers use a kennel prefix — a recurring word at the start of each dog’s name that identifies the kennel of origin. Spotting these prefixes becomes second nature after a few weeks of studying cards, and they provide an immediate clue about the dog’s breeding background and the trainer’s broader operation.
Trainer
The trainer’s name appears alongside the dog. In UK greyhound racing, the trainer is responsible for the dog’s daily conditioning, feeding, exercise and preparation for race night. Trainers at Nottingham typically hold a GBGB licence, and their performance data — strike rate, track specialisms, recent form — is publicly available through several racing data platforms. A dog’s trainer matters more than many casual punters assume. A trainer with a 20% strike rate at Nottingham running a dog with average recent form is a very different proposition from a 10% trainer running a dog that clocked a fast time last week. The card does not give you the trainer’s statistics directly, but it tells you who to look up.
Form Figures
The form string is a sequence of digits and characters representing the dog’s most recent finishing positions, usually the last six races. A figure of 1 means the dog won; 2 means second; and so on up to 6. A zero typically denotes the dog finished behind sixth place or was involved in an incident. Letters may also appear — an M might indicate the dog moved to a different track, while a hyphen or dash signals a break in racing. Reading form figures at a glance is a skill that develops quickly, and the sequence matters as much as the individual numbers. A form string of 632111 tells a radically different story from 111236, even though both contain the same digits.
Best Time and Recent Time
Most racecards display at least one time figure, and often two: the dog’s best time over the distance being raced and its most recent time. These are shown in seconds and hundredths of a second. At Nottingham, a competitive 500-metre time sits somewhere around 29 to 30 seconds for graded races, with the very best dogs dipping below 29. The best time gives you a ceiling — what this dog is capable of on a good night. The recent time gives you context — where the dog’s current form sits relative to that ceiling. A significant gap between the two is a signal worth investigating.
Weight
The dog’s racing weight is printed in kilograms, measured at the pre-race weigh-in on the night. UK regulations require dogs to race within a specified weight tolerance of their registered racing weight. A sudden change in weight can indicate various things: seasonal variation, a change in feeding routine, or in some cases, a health issue. Experienced card readers compare the printed weight to the dog’s recent racing weights, which are available in the full form guide. A dog running a kilogram heavier than its last three outings is worth noting, even if it does not always mean trouble.
Sire and Dam
The breeding information on a racecard lists the sire (father) and dam (mother). In greyhound racing, bloodlines have a measurable influence on a dog’s running characteristics — speed inheritance from the sire line, early pace and temperament from the dam. Certain sires are known for producing sprinters, others for producing stayers, and a few for producing dogs that handle specific track configurations better than others. The Nottingham racecard includes this information for a reason: it helps you assess dogs that are making their debut at this track or stepping up to an unfamiliar distance.
Comment Line
The comment line is the race-by-race running description of the dog’s most recent performance. It reads as a compressed narrative — a string of abbreviations that, once decoded, tells you exactly how the dog ran: where it started, where it sat in the pack, whether it was crowded or had a clear run, and how it finished. This single line might be the most underused field on the entire racecard. Decoding it is the subject of the next section.
Form Abbreviations and Running Comments Decoded
The comment line on a Nottingham racecard is written in a shorthand that has remained largely unchanged for decades. Each abbreviation describes a specific moment or characteristic of the dog’s run, and stringing them together recreates the race in miniature. The system is not intuitive at first, but it is consistent — learn the codes once and you can read any UK racecard, not just Nottingham’s.
Start abbreviations describe how the dog left the trap. QAw means the dog showed a quick away, breaking cleanly and reaching early speed ahead of or level with the field. SAw means slow away — the dog lost ground at the break, either through a poor jump or hesitation in the boxes. SlAw is slightly slow away, a milder version of the same problem. These start codes are enormously important on a track like Nottingham, where the first bend on the 500-metre distance arrives at just 85 metres from the traps. A dog that is slow away at Nottingham has less recovery room than on a track with a longer run to the first turn.
In-running abbreviations describe the dog’s journey through the race. EP stands for early pace — the dog showed speed in the opening section. Led means the dog led the field, either from the traps or from a point during the race. ALed means always led — the dog went to the front at the break and was never headed. Crd means crowded: the dog encountered interference, being pushed or squeezed by another runner. Bmp means bumped, a more direct form of physical contact. RnUp means ran up, describing a dog that closed on the leaders in the finishing straight without quite getting there.
A peer-reviewed study published through PubMed Central confirmed what experienced punters have long observed: dogs running the rail — the inside line closest to Trap 1 — cover the shortest actual distance around the bends. This means that abbreviations like EP and Led carry additional weight when you see them paired with a low trap number. A dog showing QAw, EP and Led from Trap 1 at Nottingham has essentially run the perfect tactical race: fast start, shortest route, never headed.
Finish-related abbreviations round out the picture. W after a distance marker describes the winning margin — for example, “W 2¼” means the dog won by two and a quarter lengths. RnIn means the dog ran into a placing position late. Ck means checked — the dog’s stride was interrupted, usually by another runner cutting across its path. Checking is different from crowding; it implies a momentary but significant loss of momentum.
When you read a full comment line — something like “QAw, EP, Led, W 3½” — you are looking at a dominant performance. The dog broke fast, showed early pace, led throughout and won by a comfortable margin. Compare that to “SAw, Crd2, RnUp” — this dog missed the break, was crowded at the second bend and only managed to close late. Same race, same six dogs, completely different story.
The skill lies not just in translating individual codes but in reading patterns across multiple races. A dog that shows QAw in five of its last six starts is a reliable breaker. A dog that shows Crd in three consecutive outings might be running into trouble because of its racing line rather than bad luck — and that is where trap draw analysis enters the picture. The abbreviations are the evidence. The racecard hands you the evidence. What you do with it is up to you.
Understanding Times, Grades and Calculated Times
Times on a Nottingham racecard appear deceptively simple — a number in seconds and hundredths — but the reality beneath that number is considerably more layered. To extract genuine insight from time data, you need to understand three related concepts: actual time, calculated time and the grading system that determines which dogs race against each other in the first place.
Actual time is exactly what it sounds like: the time recorded from trap opening to the dog crossing the finish line. At Nottingham, actual times for the 500-metre distance typically fall between 28.5 and 31 seconds, depending on the grade of race and the conditions on the night. The track has a circumference of 437 metres, with the first bend on the 500-metre course arriving at the 85-metre mark. That geometry matters because it influences how different running styles perform — dogs with blistering early speed have a shorter window to establish position before the bends compress the field.
Calculated time adjusts the actual time to account for going conditions. Every race night at Nottingham begins with a trial run — the going trial — which establishes how the sand surface is playing that evening. If conditions are slow (wet sand after rain, for instance), the going allowance adds time to the standard. If conditions are fast (dry, firm surface), the allowance subtracts. The racecard does not always display calculated time directly, but full form guides and racing data platforms will. When comparing times across different race nights, calculated time is the only meaningful comparison. A dog that clocked 29.40 on a night with a +20 going allowance ran a calculated time of 29.20 — a significantly better performance than the raw number suggests.
The grade is the competitive tier in which a dog races. Nottingham, like all GBGB-licensed tracks, uses a grading system that runs from A1 at the top through to A11 at the lower end, with Open Race (OR) designations sitting above the graded structure entirely. Dogs are promoted or demoted based on their recent results — win a race and you move up; finish outside the places consistently and you move down. Category 1 events, such as the Select Stakes and Eclipse at Nottingham, sit outside the regular grading ladder and attract the strongest dogs from across the country.
The practical implication for racecard reading is this: a time of 29.50 in an A1 race is not the same thing as a time of 29.50 in an A6 race. The A1 dog ran that time against sharper competition, likely under more pressure and in a faster-paced field. Grade context changes the meaning of every time figure on the card. When you see a dog dropping down from A3 to A5, its best time may look ordinary against higher-graded rivals but dominant against its new peers.
Promotion and demotion at Nottingham follow GBGB regulations, but the racing manager retains some discretion in grading — particularly for dogs returning from injury, switching distance or arriving from another track. A dog transferring from a track with a larger circumference (say, the 420-metre Towcester loop) may need several runs to adjust its timing to Nottingham’s tighter 437-metre oval. The racecard will not flag this adjustment explicitly, but a careful reader who notices a dog’s first or second run at a new track can factor it in.
One further nuance worth noting: sectional times. Some full form databases record split times at intermediate points around the track — typically at the first bend and the third bend. These sectional splits reveal whether a dog’s overall time came from explosive early speed followed by fading, or from a steadier pace with a strong finish. The basic racecard may not include sectionals, but knowing they exist — and where to find them — adds another dimension to the analysis. A dog that consistently records fast first-bend sectionals from Trap 1 at Nottingham is a dog with a tactical profile that suits the track geometry.
Turning Racecard Data into Selections
Reading a racecard fluently is one thing. Converting that fluency into actual selections is another. The jump from literacy to application requires a structured approach — a way of comparing six dogs across multiple dimensions without drowning in data or defaulting to the dog with the lowest recent time.
Start with trap draw. At Nottingham, Trap 1 wins approximately 18 to 19 percent of all races, against a theoretical fair share of 16.6 percent. That two-to-three-percentage-point edge does not sound dramatic until you apply it across hundreds of races and realise it is a statistically significant, structurally driven advantage. The red jacket runner has a protected inside rail and only needs to deal with pressure from one side. Before you look at anything else on the card, note which dog is in Trap 1 and ask whether its running style — early pace, rail preference — suits that position. If the card shows a dog with QAw and EP in its recent comments sitting in Trap 1, you are looking at a strong tactical fit.
Next, compare times in context. Pull the calculated times for each dog’s recent runs, not just the best time. A dog whose last three calculated times are 29.30, 29.45 and 29.38 is running with consistency. A dog whose last three are 29.10, 30.20 and 29.55 is volatile — capable of brilliance but unreliable. Both might share the same best time, but their profiles are fundamentally different. Consistency matters more than peak speed in graded racing, where the margins between runners are often less than a length.
Then layer in recent form comments. Look for patterns, not isolated performances. A dog that shows EP and Led in four of six recent runs is a frontrunner. A dog that shows RnUp and RnIn repeatedly is a closer — it will need the race to unfold in a particular way, with pace ahead of it to close on. Now cross-reference these running styles with the trap draws of the other dogs in the race. If two confirmed frontrunners are drawn in Traps 1 and 2, they are likely to contest the lead into the first bend. That crowding opens space for a mid-pack runner drawn wider to pick up the pieces.
Adrian Bower, Chief Procurement Officer at Entain, described the ambition behind the Premier Greyhound Racing media rights deal by noting it was designed to “deliver a sustainable programme going forward, support greyhound welfare, and deliver more money into the sport.” That investment in the sport’s infrastructure has improved data access for punters too — better streaming quality, more detailed race replays and wider availability of form data through partner bookmakers. The practical benefit for racecard analysis is that you can now watch replays of a dog’s recent runs to verify what the abbreviated comment line suggests. A form figure of Crd3 tells you the dog was crowded at the third bend, but watching the replay tells you whether it lost half a length or three, and whether the crowding was caused by the dog’s racing line or by an opponent’s erratic running.
Weight trends, trainer form and breeding data complete the picture. None of these fields should be examined in isolation. A dog dropping in weight, running for a trainer with a strong Nottingham strike rate, stepping down in grade and drawn in Trap 1 is a very different proposition from a dog gaining weight, trained by someone with a 5% strike rate at this track, rising in grade and drawn wide. The racecard hands you all of this information. The work of synthesis — layering one field on top of another until a clear hierarchy of the six runners emerges — is yours.
One practical tip: build a simple grid. Write the six trap numbers down the left side. Across the top, create columns for recent time, calculated time, form trend, trap draw suitability, running style and any red flags (weight change, new track, long absence). Fill in each cell from the racecard data. By the time you reach the bottom of the grid, the selections tend to announce themselves. The dogs with the strongest profiles across multiple columns are your shortlist. The dogs with glaring weaknesses in one or more columns are the ones to leave alone — regardless of what the early market says about them.
Reading a Real Nottingham Card: Step-by-Step Example
Theory is useful. Application is better. Here is a walkthrough of a hypothetical graded race at Nottingham — six dogs, 500 metres, an A4 grade meeting on a Friday evening. The dogs, the times and the form figures are illustrative, but the method is exactly what you would apply to a genuine card.
The card shows six runners. Trap 1 carries a dog with form figures 211132 and a best calculated time of 29.35. Its comment lines across the last three runs read QAw, EP, Led — QAw, EP, Crd2 — QAw, EP, Led, W 2. This is a confirmed frontrunner that breaks fast and wants the rail. It was crowded once at the second bend but otherwise dominant. Weight is steady at 31.2 kilograms across recent runs. The sire line is known for producing sprinters who handle tight tracks.
Trap 2 has form figures 344253 and a best time of 29.55. Recent comments include SAw twice and Bmp once. This dog is losing ground at the start and getting into trouble. The form trend is heading in the wrong direction, and the time figures confirm it — the last three runs were all slower than the best. Trainer strike rate at Nottingham is below 10 percent.
Trap 3 shows 112311 with a best time of 29.20 — the fastest in the race by some margin. But a closer look at the comment lines reveals that four of those six runs came at a different track, and the two Nottingham runs showed Crd3 and RnUp rather than the dominant leading runs recorded elsewhere. The dog may not have adapted to this track’s geometry yet. First-bend sectionals are available and show it arriving wide at the first turn, losing ground against rail runners.
Trap 4 carries a dog returning from an eight-week absence. Form figures before the break were 111421, but there is no recent data to work with. Weight is up by 0.8 kilograms. The comment line for its last pre-break run reads ALed, W 5 — a demolition job, but that was two months and nearly a kilogram ago. This is a risk-reward proposition.
Trap 5 has 333322 — a consistent placer that never quite wins. Best time is 29.40, recent times cluster around 29.50 to 29.60. Comments show RnUp repeatedly. This is a closer that relies on the pace collapsing in front of it. If the frontrunners get into trouble, Trap 5 picks up the pieces. If they do not, it runs third again.
Trap 6 is a recent arrival from another track, with form figures 216141. The mixed bag suggests inconsistency, but two wins from six starts is respectable. Comments show a mix of EP and SAw — the dog’s trap breaks are unreliable. From the widest trap at Nottingham, a slow break means covering extra ground into the first bend. That is hard to overcome on a 437-metre circumference.
Running the grid, Trap 1 emerges as the strongest overall profile: fast breaker, rail runner, consistent times, stable weight, suitable sire line. Trap 3 has the raw speed but has not proven it translates to Nottingham. Trap 5 is the obvious each-way play if you expect pace pressure to create problems up front. Trap 4 is the punt — high ceiling, unknown current condition. Traps 2 and 6 carry the weakest profiles and would need something to go wrong for the others to be competitive.
That is the process. Racecard to grid to shortlist to selection. Every field on the card contributed something. Nothing was wasted.