
Why Trap Draw Is the First Number Shrewd Punters Check at Nottingham
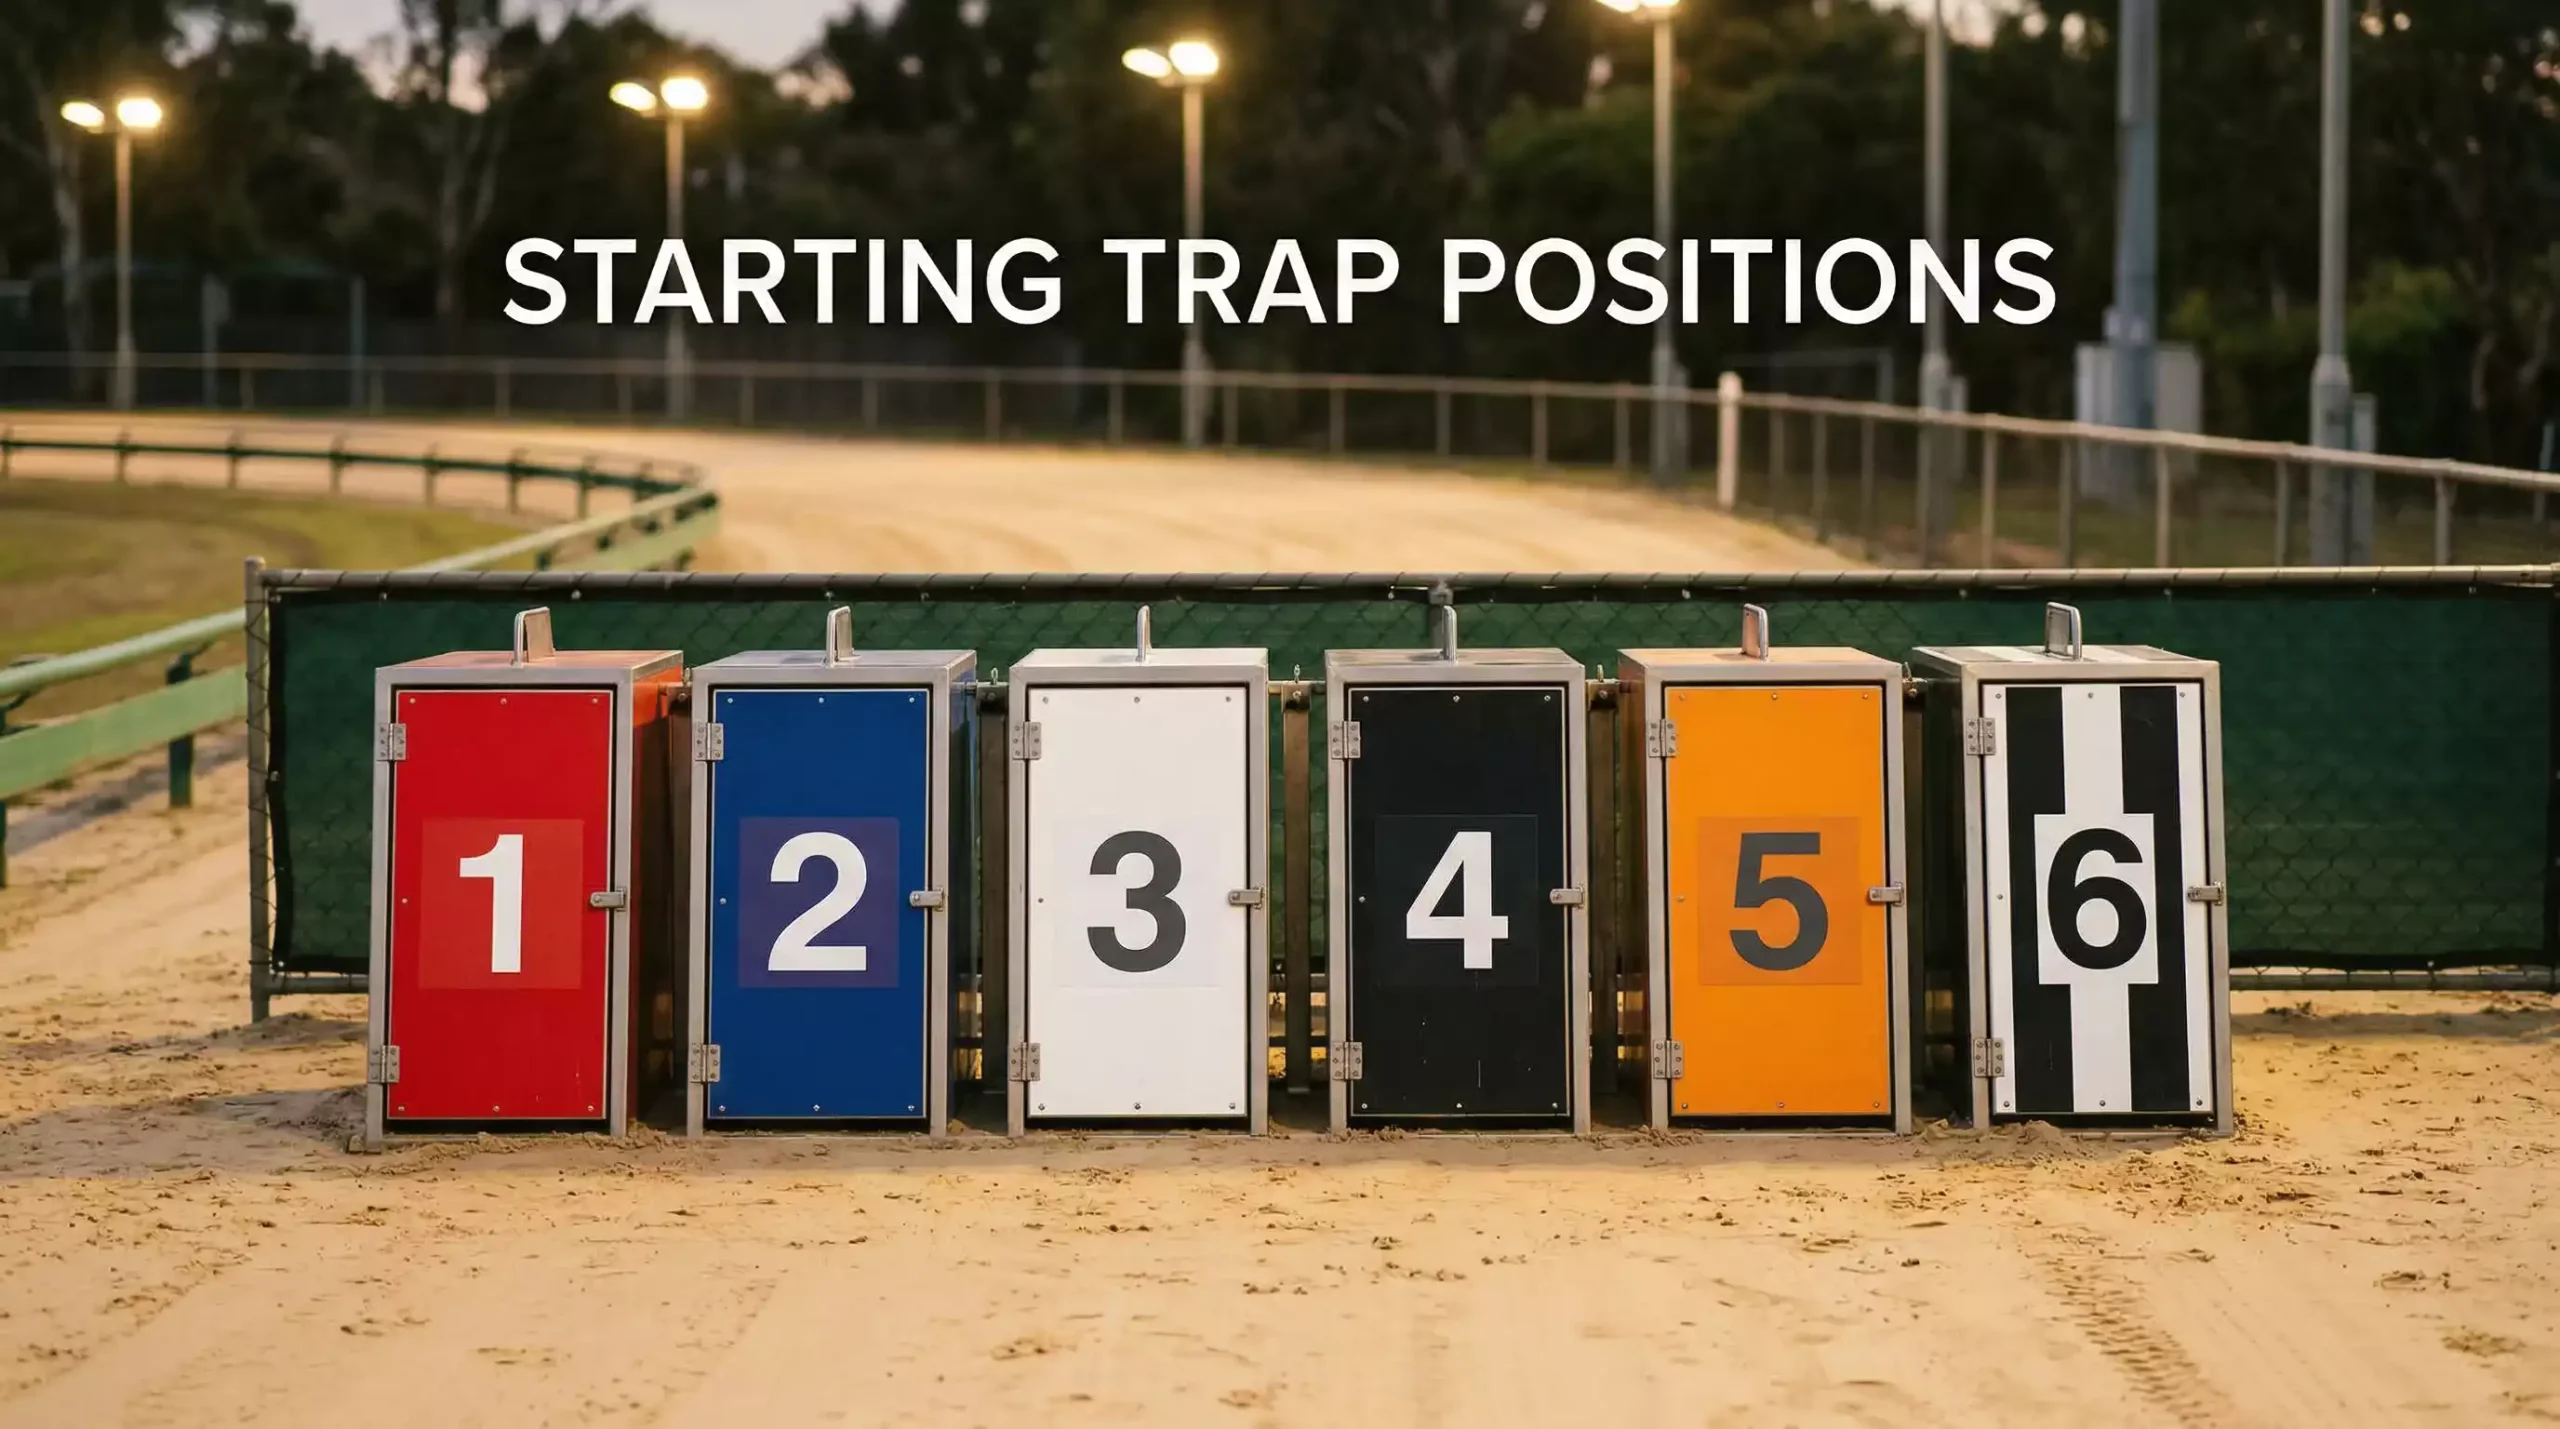
Open any Nottingham greyhound racecard and you will see six trap numbers running down the left-hand column. Most casual punters glance at them, register the colours and move straight to the form figures. Shrewd punters do the opposite. They check the Nottingham trap stats first, because the trap draw is the one variable that is known before a single dog has left the boxes — and at this track, it carries measurable weight.
The arithmetic is straightforward enough. Six traps, six dogs, one winner. In a theoretically fair race, each trap would win 16.6 percent of the time. But greyhound racing does not operate in theory. Across aggregated UK data, Trap 1 wins approximately 18 to 19 percent of all races — a gap of two to three percentage points above fair value. On a track like Nottingham, where the sand surface, the circumference and the distance to the first bend all amplify certain advantages, that gap becomes the foundation of any serious analytical approach.
This article is not a general overview of what trap bias means. That concept is covered elsewhere. What follows is a deep, data-specific breakdown of how trap draw influences results at Nottingham across different distances, different conditions and different race types. The numbers here are not abstract. They are the numbers that separate informed selections from hopeful ones.
If you bet on Nottingham regularly and you have never structured your thinking around trap data, this is the piece that changes how you look at every card.
Overall Trap Bias at Nottingham: Aggregate Win Rates
Before splitting the data by distance, it is worth establishing the aggregate picture. Across all distances and race types at Nottingham, the distribution of wins by trap is not even. It never has been, and there is no reasonable expectation that it ever will be. The geometry of the oval guarantees it.
Trap 1, the red jacket, sits on the inside rail. When the traps open, the dog in Trap 1 has the shortest route to the first bend — and at Nottingham, where the first turn on the 500-metre course arrives at just 85 metres, that shortest route matters enormously. The rail runner only has to deal with pressure from one side. Dogs in the middle traps face pressure from both flanks, which increases the probability of crowding, bumping and disrupted stride patterns. The result, measured across thousands of races, is a consistent Trap 1 win percentage in the range of 18 to 19 percent.
Academic research supports what the data shows. A study published through PubMed Central examined the relationship between box position and race outcomes in greyhound racing and found a statistically significant advantage for Box 1. The same study identified statistically significant negative effects on performance for Boxes 4, 5 and 7, suggesting that the middle and outer traps carry structural disadvantages that are not simply a function of the individual dogs drawn there. Dogs running the rail were found to cover the shortest actual distance around the bends — an intuitive finding, perhaps, but one that quantifies what many punters have treated as a rule of thumb rather than an established fact.
Trap 6, the widest draw, presents a more nuanced picture. The outside trap has the longest initial route to the first bend, but it also has clear running room on the outside flank. On shorter distances, where the first bend is the decisive tactical point, Trap 6 can still perform well if the dog has explosive early pace and can establish position before the field converges. On longer distances with more bends, the disadvantage of covering extra ground on every turn accumulates, and Trap 6 win rates tend to fall closer to or slightly below theoretical expectations.
The middle traps — 3, 4 and 5 — are where the data tells punters to tread most carefully. These positions face traffic from both sides and are most susceptible to the crowding and bumping that disrupts runs. Trap 4, in particular, often records the lowest win percentage at Nottingham, sitting well below the 16.6 percent theoretical share. This is not coincidence. It is physics: the dog in the middle of the pack has the least room to manoeuvre and the highest probability of interference.
Trap 2 typically performs close to or slightly above fair value. It benefits from proximity to the rail — a Trap 2 dog with early pace can tuck in behind or alongside Trap 1 into the first bend and ride the rail for the remainder of the race. The blue jacket is often overlooked by punters who focus on the Trap 1 narrative, but a Trap 2 runner with a QAw profile deserves attention, especially when the Trap 1 dog has a slower break pattern in its recent form.
The aggregate data sets the framework. But aggregate data is, by definition, an average across different conditions. The real analytical value lies in breaking the numbers down by distance, because a two-bend sprint and a six-bend marathon produce very different trap dynamics.
Trap Performance on the 305m Sprint
The 305-metre sprint at Nottingham is a two-bend race, and it is the distance where trap draw exerts its most decisive influence. The maths alone tells you why. With the first bend arriving approximately 85 metres from the traps on the standard 500-metre course, the 305-metre distance compresses that opening geometry even further. On a sprint, the first bend is not just an early tactical checkpoint — it is effectively the race. A dog that reaches the bend in front, on the rail, with clear running ahead will win more often than not, because there simply is not enough track remaining for rivals to close the gap.
Trap 1 dominance is most pronounced over this distance. The inside draw gives the red jacket the shortest path to the turn, and a dog with a quick away — the QAw notation on the racecard — can establish an unassailable lead within the first three seconds of the race. At Nottingham, where the tight circumference means the bends arrive quickly and the straights are relatively short, that early advantage compounds. The rail runner saves ground on both bends and has clear running through the finish straight.
Trap 6, interestingly, does not perform as badly over 305 metres as you might expect for the widest draw. The outside position allows a fast-breaking dog to avoid the first-bend traffic entirely by sweeping around the field on the outside. This works specifically on sprints because there are only two bends — the dog surrenders ground on the first but can make it up on the short straight if it carries enough raw speed. The key qualifier is pace. A Trap 6 dog with SAw in its recent form — slow away — has virtually no chance over 305 metres. A Trap 6 dog with consistent QAw figures and EP notation is a different animal. The card tells you which one you are looking at.
The middle traps — 3, 4 and 5 — face their worst prospects on the sprint. These positions are caught in the squeeze as the field converges on the first bend. On a 500-metre race, a dog that loses position at bend one has four more bends and two more straights to recover. On a 305-metre sprint, there is no recovery zone. Crowding at the first turn is essentially a race-ending event for a mid-pack dog.
For punters looking at a 305-metre card at Nottingham, the analytical framework simplifies considerably. Check Trap 1 first: does the dog have early pace? If yes, it is the market principal until proven otherwise. Check Trap 6 next: is the dog a confirmed fast breaker? If yes, it is the main danger. The middle traps need an extraordinary dog or extraordinary circumstances to overcome the structural disadvantage. When two confirmed frontrunners are drawn in Traps 1 and 2, expect a contested first bend — and that is when the each-way value shifts to the wider traps that can exploit the mess.
Trap Stats for the 500m Standard Distance
The 500-metre race is the bread-and-butter distance at Nottingham — the format that fills the card on Monday and Friday evenings, the distance where the grading system operates at its fullest, and the trip where most punters accumulate the bulk of their data. It is a four-bend race on a 437-metre circumference, which means the dogs negotiate two full laps minus approximately 60 metres. That additional racing distance, compared to the 305-metre sprint, changes the trap dynamics in several important ways.
Trap 1 retains its edge at 500 metres, but the advantage is somewhat diluted compared to the sprint. The explanation is mechanical: with four bends rather than two, the race unfolds in stages, and there are more opportunities for the field to reshuffle. A dog that is crowded at the first bend can recover on the back straight, reposition at the third bend and make a run on the final turn. That recovery window does not exist over 305 metres. Over 500, it does — and it means that the middle traps, while still disadvantaged, have a slightly better chance of producing a winner.
The first-bend dynamic remains critical, however. That 85-metre run from the traps to the first turn is the same regardless of race distance, and the dog that arrives there in front still gains a significant positional advantage. The difference at 500 metres is that the positional advantage needs to be maintained for longer. A Trap 1 dog with early pace but questionable stamina — one that leads into the third bend but fades on the final turn — can be caught by a better-finishing rival that took a wider, cleaner route through the early bends.
Trap 2 tends to perform relatively well over 500 metres at Nottingham, and the reason is tactical. The blue jacket sits close enough to the rail that a dog with early pace can slot in behind or beside the Trap 1 runner and ride the inside line for four bends. If the Trap 1 dog tires or drifts wide, the Trap 2 dog is perfectly positioned to inherit the rail. In form terms, look for Trap 2 dogs with EP and RnUp comments — dogs that show early pace and a strong late run. These dogs are playing the patient game, using Trap 1 as a shield through the first two bends before making their move.
The outer traps — 5 and 6 — face a more honest assessment at 500 metres. Four bends means covering extra ground on every turn, and the cumulative distance penalty for a wide runner over 500 metres is considerably greater than over 305. A Trap 6 dog needs to be genuinely faster than its rivals to overcome the geometry. This is not impossible — graded racing occasionally produces a dog whose raw speed makes the trap draw irrelevant — but it is less common than the sprint distance, where one burst of acceleration can compensate for a wider arc.
For the analytical punter, the 500-metre race at Nottingham demands a more balanced assessment than the sprint. Trap draw still matters — Trap 1 remains the strongest position — but the weight you assign to it should be moderated by the dog’s stamina profile, its recent comment lines over four bends and the competitive context of the race. A strong Trap 1 frontrunner in an A8 race with five moderate rivals is close to a certainty. The same dog in an A2 race with two other confirmed frontrunners in Traps 2 and 3 faces a completely different challenge. The card gives you the information to distinguish between these scenarios. The trap stats tell you how much that information is worth.
Trap Trends Over 680m and Beyond
Nottingham offers stayer distances at 680, 700, 730, 885, 905 and 925 metres — races that take dogs through six or more bends and test endurance as much as speed. At these distances, the relationship between trap draw and outcome shifts again, and the data tells a story that surprises some punters who have internalised the Trap 1 dominance of shorter races.
The Trap 1 advantage does not disappear over staying distances, but it diminishes. The logic is cumulative. Over six bends, the early positional advantage gained at the first turn is diluted by the sheer number of reshuffling points. A dog that leads from Trap 1 into the first bend must sustain that position through five more turns and three more straights. If its stamina gives out at the fifth bend, the positional advantage it established at the first one is worthless. Stayer races are decided by the dogs that are still accelerating — or at least maintaining pace — when the others have begun to tire.
Middle traps become marginally more competitive at staying distances, because the interference that plagues them over shorter races has more time to dissipate. A dog crowded at bend one has five more bends to find space and reposition. The comment lines in stayer form often reflect this: you will see more RnUp and RnIn notations, more late surges, more positional changes between the fourth and sixth bends. The race is more fluid, and fluidity tends to dilute the structural advantages of specific trap positions.
Rail runners still save ground on every bend — the physical geometry does not change — but at staying distances, the ability to save ground must be weighed against the ability to sustain effort. A dog that saves three lengths through tighter arcs over six bends but lacks the stamina to maintain speed on the straights will still lose to a wider-running dog with superior endurance. This is where the racecard’s breeding information becomes especially relevant. Sire lines known for stamina rather than sprint speed produce dogs that are better equipped for the marathon distances, regardless of which trap they are drawn in.
For punters approaching a 680-metre or longer race at Nottingham, the practical adjustment is to reduce the weight assigned to trap draw in your analysis and increase the weight assigned to stamina indicators: comment lines showing strong finishes in recent stayer races, calculated times that hold up in the closing sections, and trainer records with stayer specialists. Trap draw is still a factor — you would not ignore it entirely — but it drops from being the primary filter to one of several equally important ones. And even that adjusted weighting assumes consistent conditions underfoot, which brings us to the variable that reshapes trap bias data from one meeting to the next.
How Weather and Going Affect Trap Bias
Nottingham races on a sand-based all-weather surface, which means the track is usable in conditions that would shut down turf racing. But “usable” does not mean “consistent.” Sand behaves differently when it is wet, dry, cold or warm, and those behavioural differences change how the dogs run — and, crucially, how the trap biases manifest.
Rain is the most significant weather variable. Heavy rain saturates the sand surface, making it heavier and slower. Times across the board are affected, which is why the going allowance system exists — to adjust raw times for surface conditions and produce a fair comparison across meetings. But rain does not affect all traps equally. A wet track tends to amplify the inside-rail advantage, because the rail line is typically the best-drained and most compacted section of the track. Dogs running wider arcs are covering more of the softer, wetter surface, which increases the energy cost of each stride. On a rain-affected night at Nottingham, Trap 1 and Trap 2 runners can benefit beyond their normal statistical edge.
Wind is a subtler factor but one that experienced Nottingham regulars track closely. The Colwick Park site is relatively exposed, and a strong headwind on the finishing straight will slow every dog — but it will slow tiring dogs more than fresh ones. In stayer races on windy nights, the dogs that have saved the most energy through the middle bends (typically rail runners taking the tightest arcs) tend to cope better with the headwind on the run-in. Conversely, a strong tailwind on the finishing straight can flatten out the field, giving closers and wide runners a better chance of reeling in the leaders.
Temperature affects sand consistency in a different way. Cold nights can make the surface firmer and faster, while warmer evenings — particularly after a dry spell — can leave the sand looser and slower. The going trial at the start of each meeting captures these conditions and produces the going allowance number, but the trial measures overall track speed rather than trap-specific speed. A punter who notes that Trap 1 times tend to be slightly faster on cold, firm nights than on warm, slow ones is adding a layer of analysis that most competitors are not applying.
Mark Bird, CEO of the Greyhound Board of Great Britain, has spoken about the industry’s commitment to sustained improvement, noting that recent welfare and operational initiatives “are now embedded and are helping to consolidate significant progress.” Part of that progress includes better track maintenance and surface management across GBGB-licensed venues, which reduces the extremes of going variation — but it does not eliminate them. Weather remains an uncontrolled variable, and its interaction with trap bias at Nottingham is real.
The practical application for punters is to check the going allowance before finalising selections and to recognise that trap bias data collected on firm, fast nights may not apply directly on heavy, slow nights. If your analysis leans heavily on Trap 1 in sprint races, a wet card might reinforce that lean. If you are backing a wider-drawn stayer on a night when the surface is playing heavy, you might need to reconsider. The data does not change, but the conditions in which you apply it do.
Using Trap Data in Your Nottingham Selections
The numbers have been laid out: Trap 1 wins more than its fair share, the advantage is strongest over sprints and weaker over staying distances, the middle traps underperform, and weather modulates everything. Now the question is what you actually do with all of this when you sit down with a Nottingham card.
The first step is establishing a baseline expectation for each race. Look at the distance, check the going allowance if available, and assign a trap-bias weighting accordingly. For a 305-metre sprint on a standard going night, trap draw should be one of your top two analytical factors — alongside recent form comments — because the data says it accounts for a measurable portion of the outcome. For a 680-metre stayer, drop it to a secondary factor and elevate stamina indicators and finishing speed. For a 500-metre race, treat trap draw as one of three or four equally weighted inputs: trap position, recent calculated time, running style and grade context.
The second step is integrating trap data with the dog’s running profile. A strong trap draw paired with a suitable running style is a multiplier. Trap 1 with a QAw, EP frontrunner is the textbook example — the structural advantage of the trap aligns with the tactical advantage of the dog’s preferred race pattern. But a poor trap draw paired with a strong dog does not automatically become a losing selection. It becomes a selection that carries additional risk, and the odds should reflect that additional risk. If the market prices Trap 4 dog as a 3/1 chance but your analysis says its trap position adds half a length of structural disadvantage, you might need 7/2 or better before the bet makes sense.
This is where the concept of value intersects with trap bias. Across all tracks and all distances, favourites in greyhound racing win approximately 30 percent of the time. That means 70 percent of the time, the market’s first choice loses. Trap data helps you identify cases where the market has not fully accounted for the structural advantage or disadvantage of the draw. A Trap 1 dog with strong form that is priced at 5/2 while a slightly faster Trap 4 dog heads the market at 6/4 is a common scenario. The raw speed favours Trap 4, but the trap data says Trap 1 has a 2-to-3-percentage-point structural edge plus clearer running into the first bend. If the form is close, the trap draw might be the tiebreaker — and the price on Trap 1 reflects better value because the market has weighted speed over position.
Build this thinking into a simple process. Before each race, note the distance and assign your trap-bias weighting. Scan the traps in order of statistical advantage — Trap 1 first, Trap 2 second, then the outside traps, then the middle. For each dog, check whether the running style aligns with the trap position. Cross-reference with recent times and form comments. Eliminate dogs with clear disadvantages: poor trap draw combined with slow break patterns, or wide draws with stamina questions over the relevant distance. The dogs that survive this filter are your shortlist.
One final point worth stressing: trap statistics are a tool, not a system. They do not replace the work of reading form, assessing times and understanding grade context. They add a layer of structural insight that many punters overlook, and at Nottingham — where the track geometry creates genuine, measurable bias — that layer is worth more than at tracks with larger circumferences and longer runs to the first bend. Used properly, trap data sharpens every selection you make. Used in isolation, it is just another number on a screen. The difference is in how you integrate it.